

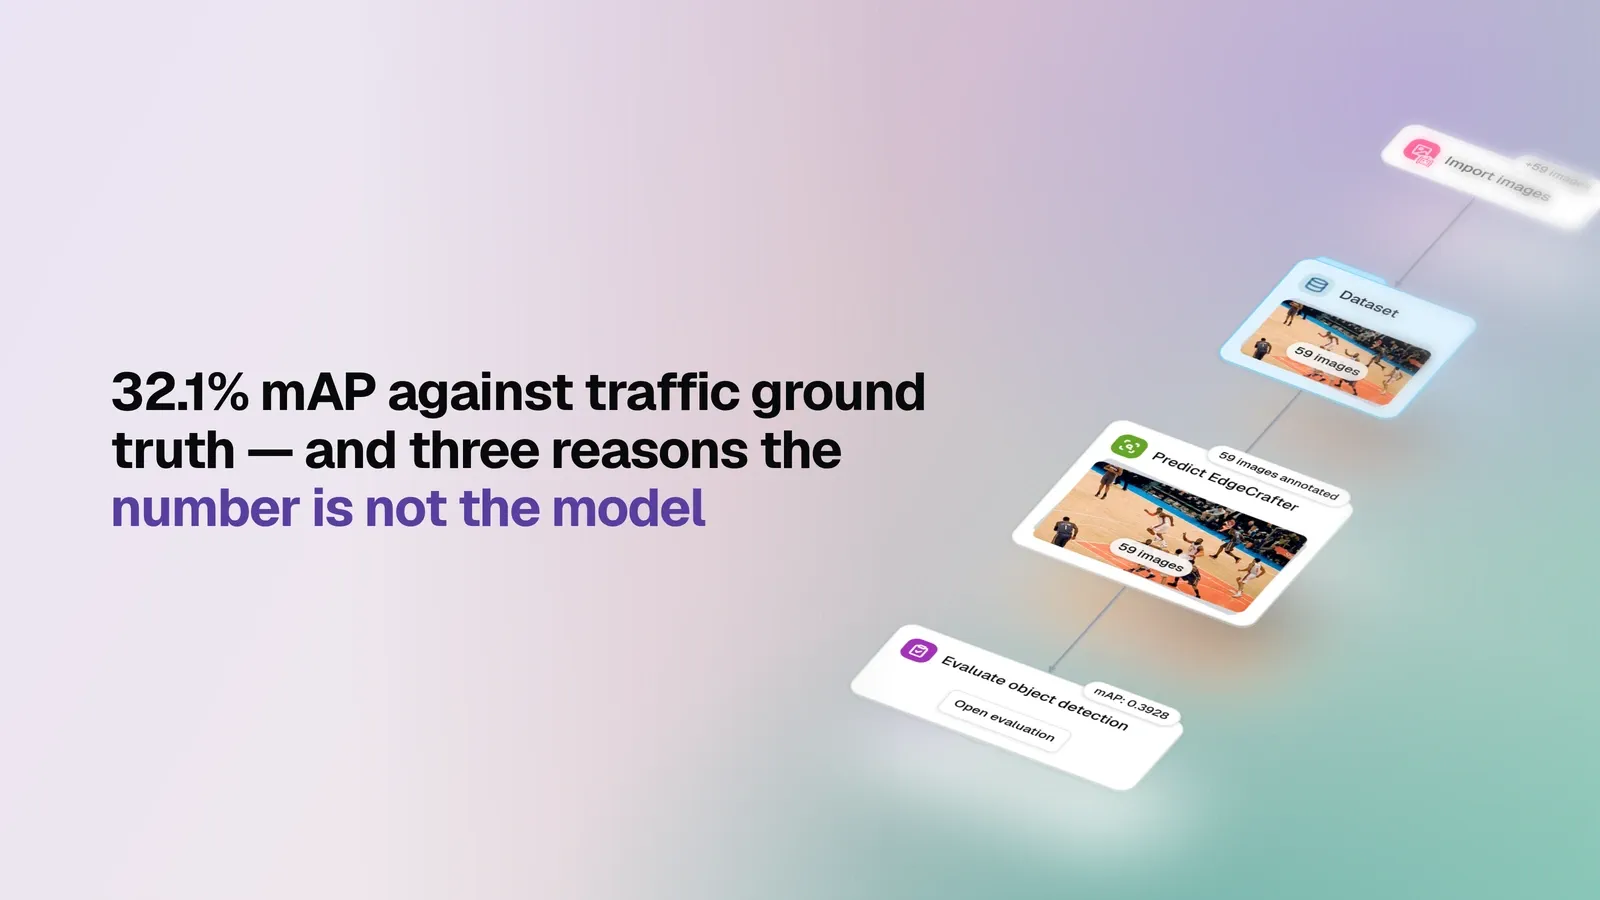
Accepting a model needs a number, then needs reading
An acceptance decision comes down to one question: measured against real ground truth, how good is this model? Not better or worse than a rival candidate — just this one model against a fixed reference, scored the same way every time so the same check can run again after a retrain or a version bump.
This run answers that. It also demonstrates the part that gets skipped: an evaluation number is a property of the model and the test, and on this pool three separate effects push the headline far below what the model actually did.
The test setup
| Setting | Value |
|---|---|
| Model | EdgeCrafter ecdet_s, pretrained weights, no fine-tuning |
| Reference set | 226 labeled traffic images, 8 classes, 725 ground-truth objects |
| Prediction confidence | 0.4 at inference, 1,070 boxes returned |
| Evaluation IoU | 0.50 |
| Operating threshold | 0.8713, selected automatically |
| Max detections per image | 100 |
The reference is real street photography labeled for the everyday road mix — bicycle, bus, car,
motorcycle, person, stop_sign, traffic_light, truck — with support running from 54 to 170
instances per class. That matters: every class here has enough objects for its own score to be worth
reading, which is not true of most public test sets.
Read the classes, not the average
| Class | GT objects | mAP 50:95 | AP50 | Precision | Recall | F1 |
|---|---|---|---|---|---|---|
| truck | 60 | 50.1% | 50.3% | 93.4% | 49.8% | 65.0% |
| bus | 74 | 45.7% | 48.2% | 96.9% | 41.9% | 58.5% |
| car | 82 | 45.1% | 46.0% | 58.4% | 49.2% | 53.4% |
| motorcycle | 61 | 43.5% | 47.1% | 95.8% | 37.7% | 54.1% |
| bicycle | 84 | 42.2% | 46.8% | 95.2% | 37.4% | 53.7% |
| person | 170 | 30.0% | 32.4% | 60.7% | 29.3% | 39.5% |
| stop_sign | 54 | 0.0% | 0.0% | 0.0% | 0.0% | 0.0% |
| traffic_light | 140 | 0.0% | 0.0% | 0.0% | 0.0% | 0.0% |
Two shapes stand out among the six classes that scored at all.
Four classes are almost never wrong when they fire, and quiet the rest of the time. bicycle,
bus, motorcycle, and truck land between 93.4% and 96.9% precision against recall between
37.4% and 49.8%. That is a model that declines to guess: it flags what it is sure about and
leaves the rest. For a review or pre-labeling workflow that is the useful failure direction. For a
safety-facing system it is the dangerous one.
person is the most common class and the weakest. 170 of the 725 objects, and the lowest scores
in the table: 30.0% mAP, 29.3% recall, 39.5% F1. car is the one class where the model is
noticeably more willing to guess — 58.4% precision against 49.2% recall — trading precision
for coverage.
Localization is not the problem anywhere. Mean IoU on matched boxes is 96.4%: when this detector does claim an object, the box is tight.
Reason one: two classes lost to a spelling difference
stop_sign and traffic_light read 0.0% across every column. The detector did not fail to see them.
The ground truth spells the class names with an underscore; the model emits stop sign and
traffic light with a space. Nothing matches, so nothing scores.
The report says so directly: its frequently-confused pairs are exactly stop_sign ↔ stop sign and
traffic_light ↔ traffic light, both at a confusion probability of 1.0 — every single instance
confused, which is the signature of a naming mismatch rather than a visual one.
Those two classes hold 194 of the 725 ground-truth objects — 27% of the reference set — and they are unscored, not failed. Any comparison of this checkpoint against another one on this test carries the same 194-object hole until the class names are reconciled.
Reason two: the aggregates are averaged over 32 labels
The report tracks 32 class labels for this run: the union of the eight ground-truth classes and the
public vocabulary the pretrained model predicts in — backpack, bench, bird, boat, couch,
dog, and the rest.
AP50, precision, recall, and F1 average across all 32. Twenty-six of them have no ground truth in a traffic pool at all, contribute a zero each, and pull those four numbers to 8.5%, 15.6%, 7.7%, and 10.1% — figures that describe a denominator, not a detector. mAP and AP75 average over the eight ground-truth classes only, which is why 32.1% and 33.0% are the two headline numbers worth quoting at all.
The practical rule: on any evaluation of a pretrained model against a narrower reference set, check what the average was taken over before quoting it.
Reason three: the pool labels one class per image
This reference set is organized by subject category, and its labeling follows: in 223 of the 226 images the ground truth contains objects of a single class. A pedestrian photo labels pedestrians — the parked cars in the same frame are simply not annotated.
A detector that finds every class it knows is therefore penalized for being right about objects the test never labeled.
At the operating point the run counts 211 true positives, 99 false positives, and 514
misses. The misses are genuine within this test’s terms — though 194 of them are the naming casualties
above — while part of the false-positive count is this labeling artifact rather than a model error.
car precision of 58.4%, the lowest among the vehicle classes, is the clearest place that effect
lands.
Why recall is low: the threshold, not the model
The scoring step selected its operating threshold automatically and landed at 0.8713 — very high for a detector that returned boxes down to 0.4.
The distribution explains the choice. In the 0.4–0.5 bin, 189 false positives accompany 2 true positives; in the 0.9–1.0 bin, 185 true positives against 62 false. A threshold picked for the best balance has to sit near the top, and that is what suppresses recall at the operating point. AP and mAP are computed across all confidences and are unaffected — another reason the per-class AP column is the one to read for acceptance, with precision and recall describing one particular operating point.
The verdict, stated honestly
Against this reference set, this pretrained detector is precise and conservative on vehicles —
50.1% mAP and 93.4% precision on trucks, above 95% precision on buses, bicycles, and motorcycles —
weakest on the class that matters most in traffic, with person at 30.0% mAP and 29.3% recall, and
unmeasured on signage until the class names are reconciled.
That is enough to accept the model for a review-assist or pre-labeling role on vehicles, and not enough to accept it for anything pedestrian-facing. What it is not is a 8.5% AP50 model, which is what an unread headline would have said.
Two fixes make the next run of this same check materially better: map the model’s class names onto the ground truth’s before scoring, and either restrict scoring to each image’s labeled class or complete the labeling. Because the prediction and the scoring ran as one recorded sequence against a fixed reference, rerunning after either fix — or after a retrain — produces a number comparable to this one by construction, instead of a fresh spot check whose method quietly moved.