

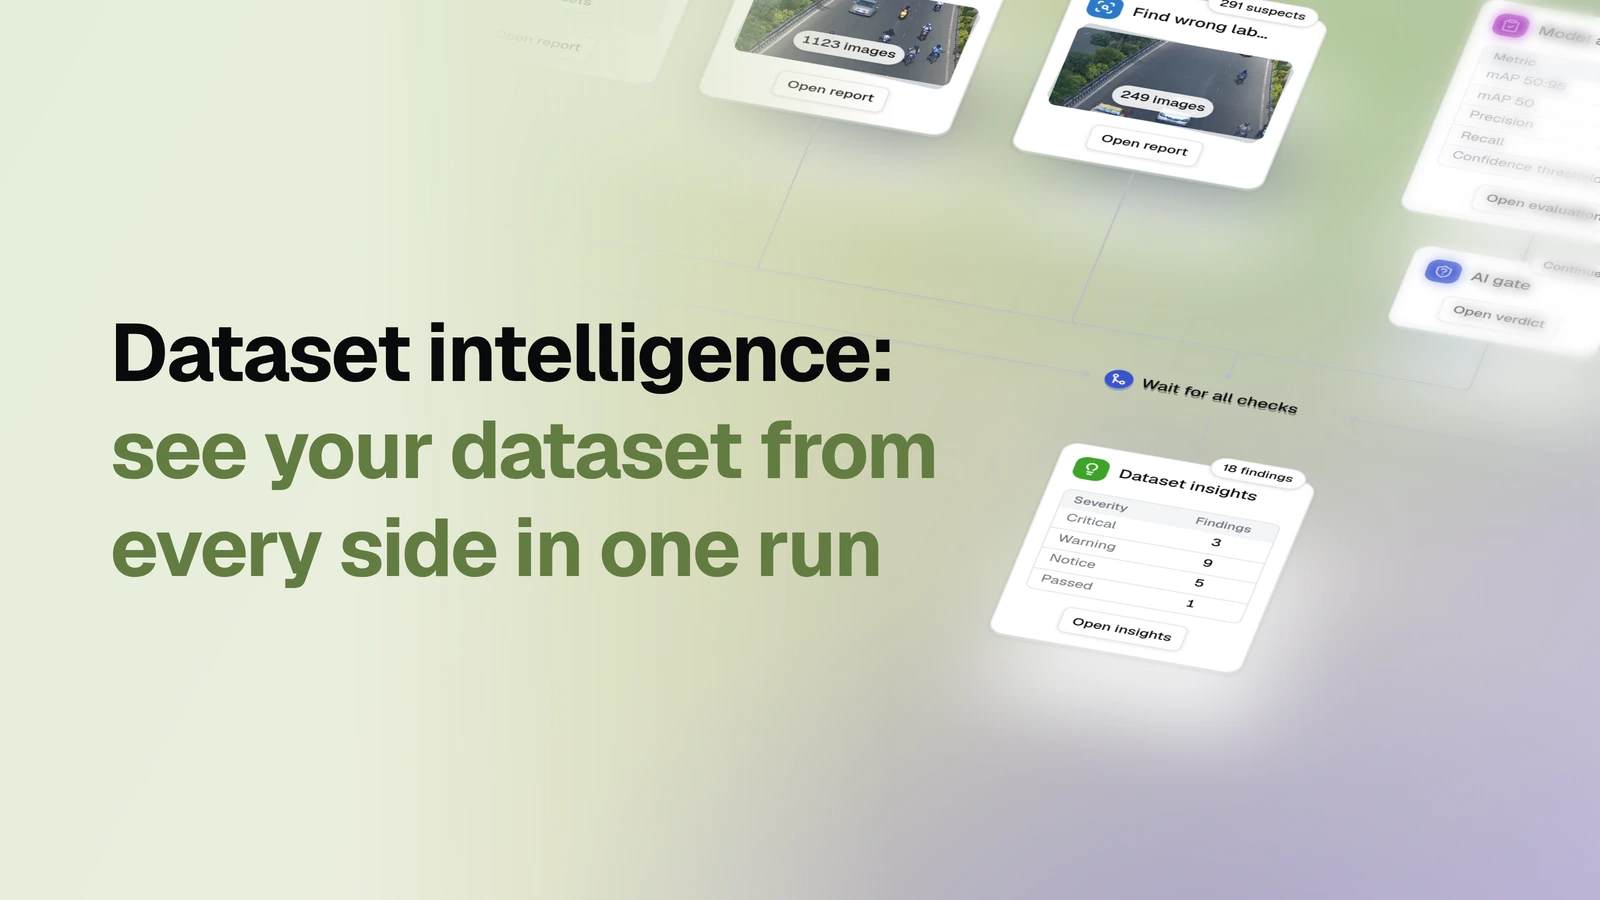
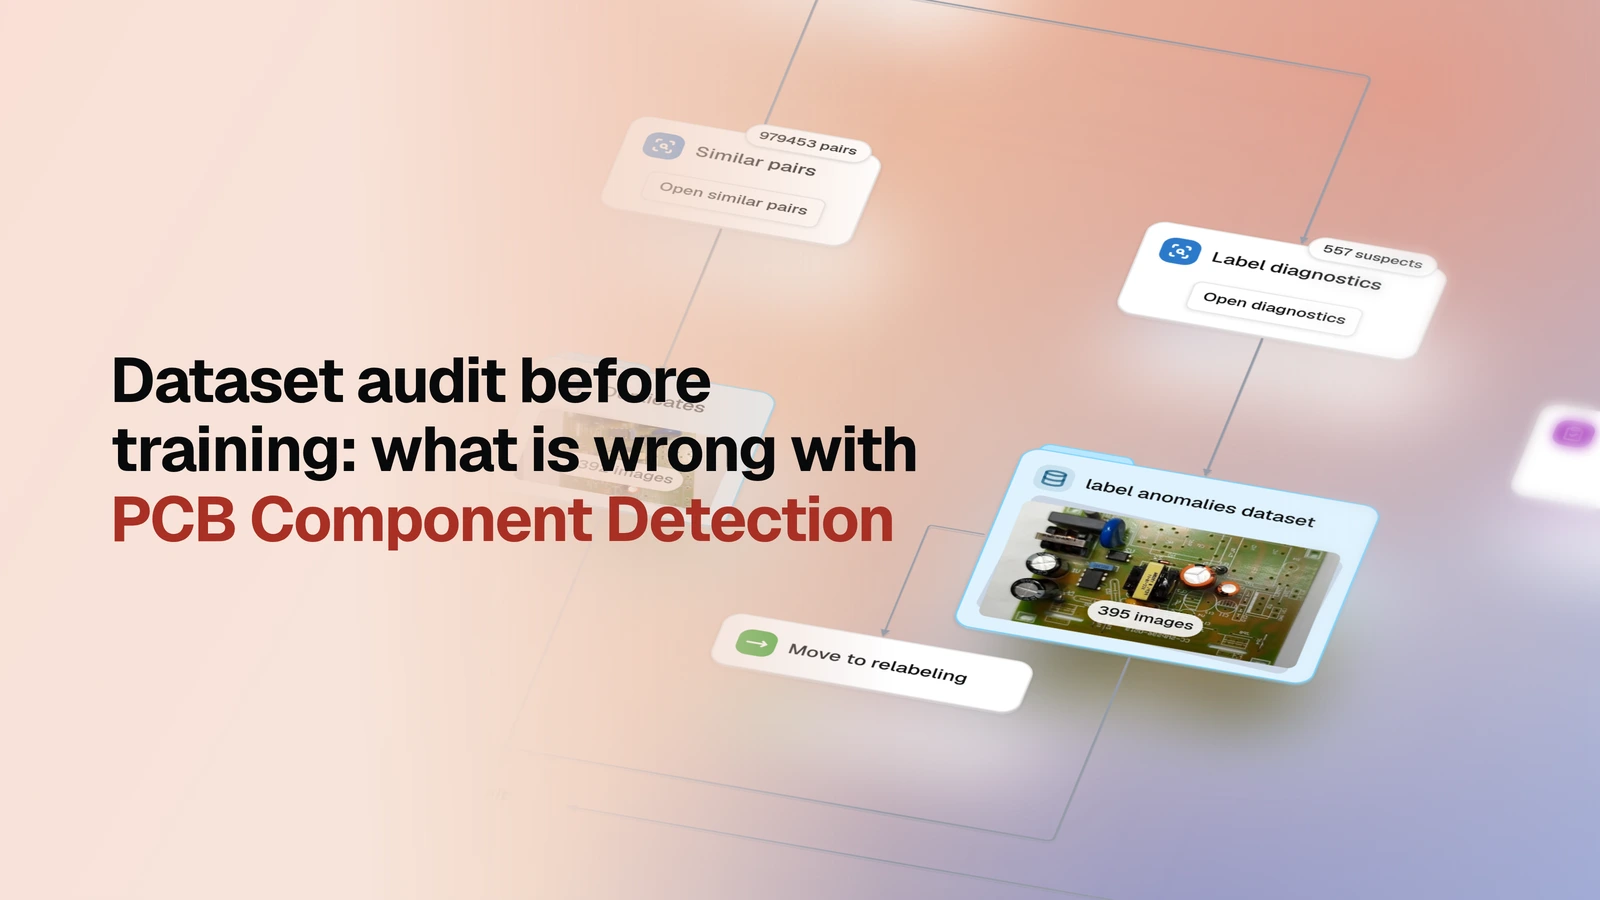
See a labeled detection dataset from every side in one run, and get a summary report that ranks what it found and says what to fix first.
Main idea: one dataset goes through statistics, image and label quality checks and embedding searches at once. Each check writes its own report, and the summary report reads them all and turns them into one verdict and a to-do list.
Run it before you spend on training or relabeling: on a dataset someone else built, on a new delivery from a vendor, or on your own data after a big change.
Overview
- Model: CLIP and DINOv3 embeddings for the similarity checks
- Task: Dataset audit for object detection
- Input: A labeled image dataset with bounding boxes
- Pipeline: dataset -> statistics and quality checks, embedding checks in parallel -> summary report
- Output: A report from every check, a summary report with findings ranked by severity and a do-first list, and candidate datasets for review
Setup
When you add the template, the setup wizard asks one question:
| Question | What you do |
|---|---|
| Which dataset do you want to check? | Pick a labeled dataset from your workspace. |
Press Start and the audit runs. Everything else is already wired.
To bring a dataset in first, use Import from Dataset Ninja, Import from Supervisely or Import images by drag & drop.
The summary report is written by the language model of your OvalBee instance and charged to the workspace's credits.
How it works
Two branches run in parallel and do not block each other. When both finish, the summary report reads every report together.
| Node | What happens | Docs |
|---|---|---|
| Your dataset | The dataset you picked in the wizard. | Dataset |
| Dataset stats | Class balance, boxes per image, object sizes, class mix per split. | Compute stats |
| Image quality | Broken and blank files, blur and exposure measured against the dataset itself, resolutions. | Image quality |
| Label quality | Duplicate labels, byte-identical images, empty images, tiny and oversized boxes, where objects sit in the frame. | Annotation quality |
| Build AI index | Embeds every image and object once, for the checks below. | AI index |
| Embedding map | An interactive map of the whole dataset, grouped into clusters. | Embedding map |
| Find duplicates | Exact copies, near-identical and similar images, and the groups that can leak between splits. | Similar pairs |
| Find anomalies | Images that look unlike the rest. | Embedding anomalies |
| Find wrong labels | Objects that look closer to another class, and the least typical objects of each class. | Label diagnostics |
| Dataset insights | The summary report: reads every report and writes the verdict. | Dataset insights |
Key concepts
Not measured is not passed. When a check cannot answer on your data, for example when its threshold sits above every score, the summary report files it under "not measured" instead of calling it clean.
Results
- Dataset insights. The summary report. A verdict and findings ranked Critical, Warning, Notice and Passed, with the frames behind each one; a do-first list; open questions only the dataset owner can answer; what checked out fine and what could not be measured.
- A report from every check. Each keeps its full detail, charts and galleries. Open any node to read it.
- Candidate datasets. Duplicates, anomalies and suspected wrong labels, each in its own dataset, ready for review.
Next steps
- Zero-shot prelabeling check — get a zero-shot detector's second opinion on the labels, and see how much labeling work its boxes would save.
- Filter-based data cleanup — apply a mechanical fix, such as a class rename, with rules and confirm it with fresh statistics.
- Labeling with review loop — send a candidate dataset through labeling and review.
- Dataset quality control — the lighter profile when you only need class counts, balance and coverage.